Caloosahatchee River EFDC
The Caloosahatchee River Basin, extending from Lake Okeechobee to San Carlos Bay on Florida’s west coast, has several Waterbody Identification units (WBIDs) included in the State of Florida’s 2004 list of impaired water bodies because of nutrient enrichment and oxygen depletion. The Caloosahatchee River is characterized by freshwater flows from Lake Okeechobee in its upper reach receiving agricultural discharge and urban runoff from Ft Myers before entering the Caloosahatchee Estuary.
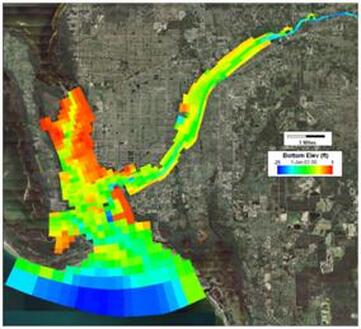
A linked HSPF watershed and 3-D hydrodynamic (EFDC), sediment transport (EFDC), and water quality and sediment flux (EFDC, WASP7) model of the 1,400 square mile Caloosahatchee watershed and the 60 mile-long estuary was constructed. The EFDC model was developed to spatially varying flow and transport of water, salinity, and nutrients through the system, including under and around the bridges to Sanibel and Pine Islands. The HSPF model, used to simulate streamflow and nutrient loads for input to the hydrodynamic and water quality model, was developed to represent land uses and mass loading outputs with different jurisdictional boundaries and sub-watersheds. Existing BMPs in sub-watersheds and jurisdictional boundaries were represented in the HSPF model to account for nutrient removal efficiencies of BMPs. HSPF model results were summarized as tables of seasonal mass load budgets for nutrients with load data compiled by land use, sub-watersheds and jurisdictional boundaries. Atmospheric deposition of nutrients was represented in both the HSPF and EFDC models. The models were calibrated to temporal and spatial variability of water levels, salinity, and nutrients throughout the system. Dynamic Solutions participated in monthly stakeholder public meetings to provide information and obtain feedback for inclusion in the modeling process.
Submerged aquatic vegetation (SAV), such as sea grass, is seen by many as an indicator of the overall ecosystem health of coastal waters so Dynamic Solutions also added the capability to EFDC_Explorer to post-process EFDC simulation results to characterize the attenuation of sunlight in the water column. When applied to areas of a water body whose depth is within the growing range of SAV the simulation can provide insight on the effectiveness of alternative water quality management options for improving water clarity to sustain, or restore, the establishment of SAV beds.
Return to the EFDC page